Analytics
Analytics turns the data the app already collects into four decisions: what to restock, what actually makes money once Amazon has taken its cut, how often you win the Buy Box, and what has shipped from Amazon's warehouses.
Interactive walkthrough
Prefer to see it in action? Open the guided walkthrough, an animated, click-by-click tour you can play automatically or step through yourself.
Analytics is a paid feature, included on Growth and above. On the Free plan the screen is not available. See Plans and billing.
The four views
The screen is organised as four views. They draw on different data, so it is worth knowing which question each one is built to answer.
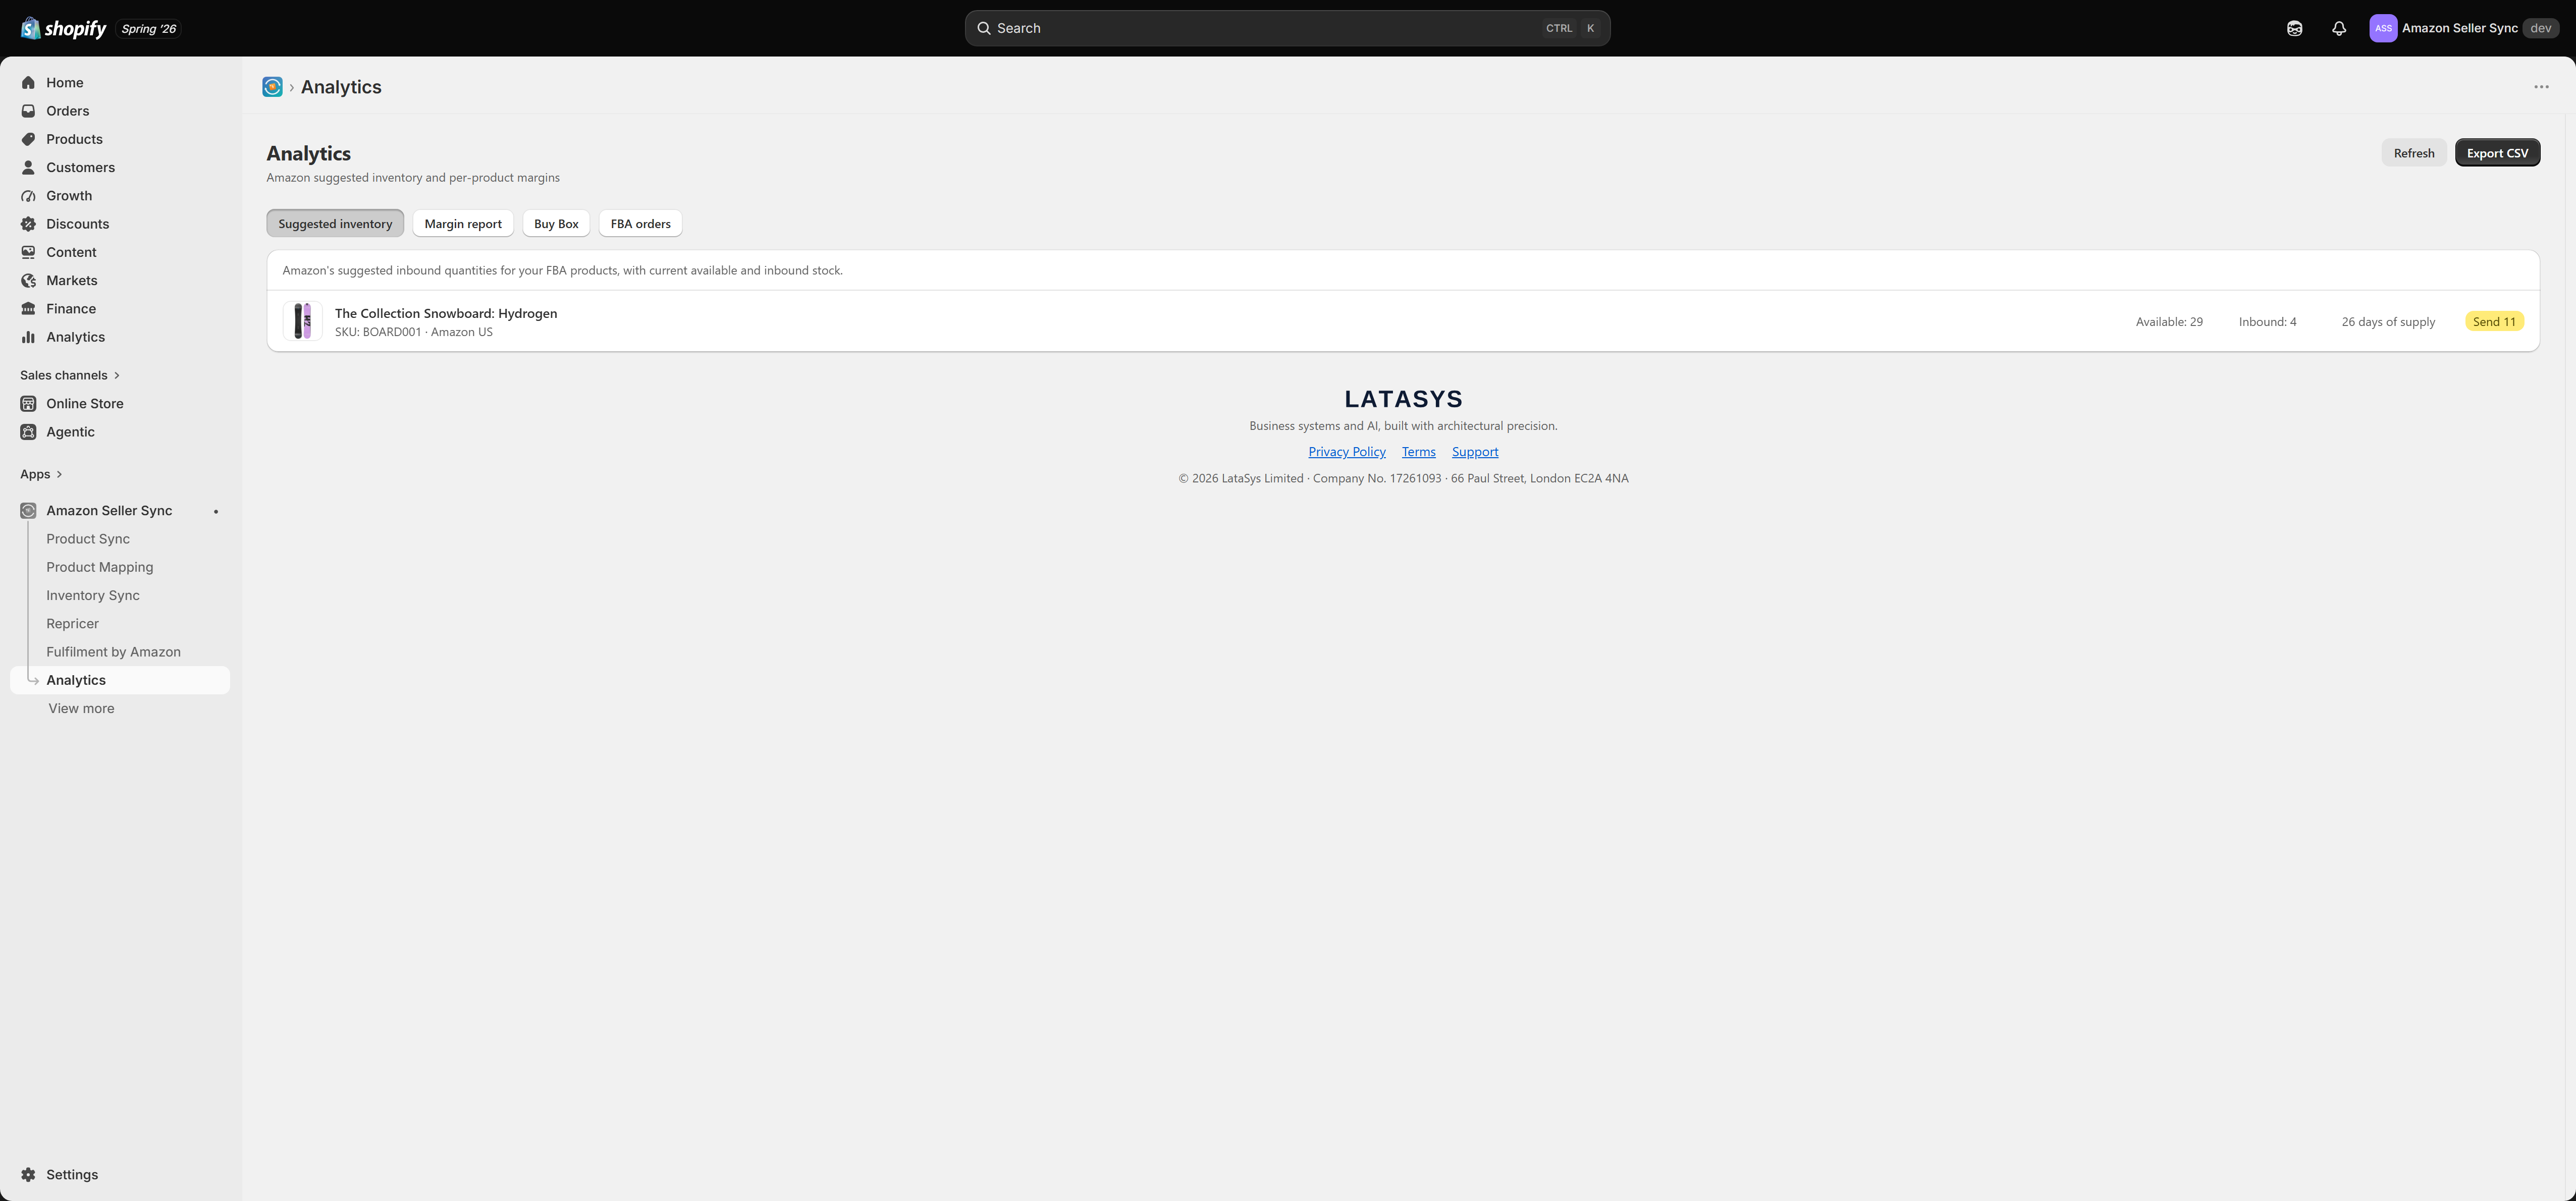
Suggested inventory
The question: am I about to run out of stock at Amazon?
This view surfaces Amazon's own suggested inbound quantities for your FBA products (FBA means Fulfilment by Amazon, where Amazon holds and ships your stock). Each row shows the available stock Amazon is holding, the stock already inbound to Amazon, an estimated days of supply, and a suggested quantity to send.
The numbers are Amazon's recommendation, not the app's, and the view only covers FBA products.
Read the full article: Suggested inventory.
Margin report
The question: which of my products actually make money on Amazon?
This view calculates, per product, your selling price minus Amazon's fees minus your own unit cost. It is the honest picture of what a listing earns after Amazon has taken referral and fulfilment fees, and it regularly surprises people. Products with healthy revenue can still be losing money once fees land.
Rows are colour coded by margin and a negative margin gets a Loss badge. The report also tells you, row by row, when it is working from incomplete inputs.
Read the full article: Margin report.
Buy Box
The question: how often am I actually winning the Buy Box, and is it getting better or worse?
This view shows the share of the time your mapped products held the Buy Box over a period you choose, along with a daily trend and a per-product breakdown. It is the report to open after you change your pricing or turn on the Repricer, because it is the only place you can see the effect over time rather than at a single moment.
The important thing to understand is that Buy Box history is recorded on each price sync, so it builds up gradually. A brand-new store has nothing to show yet, and that is expected.
Read the full article: Buy Box performance.
FBA orders
The question: what has Amazon shipped for me?
This view lists your Shopify orders that were fulfilled by Amazon FBA, with their status and tracking details, so you can reconcile Amazon's fulfilment activity without leaving Shopify. It is populated by the Multi-Channel Fulfilment feature, so it stays empty unless you are using it. See Fulfilment by Amazon for how orders get routed to Amazon in the first place.
Export CSV
Every view has an Export CSV button. It downloads exactly the data you are looking at, so you can open it in a spreadsheet, hand it to your accountant, or work through a restock plan offline. There is no separate export screen and no scheduled export. What is on screen is what you get.
Why a report can look empty
Analytics reflects your mapped and listed products, so an empty report is usually a data question rather than a fault:
- Suggested inventory is empty if you have no FBA stock at Amazon.
- Margin report needs listed products and unit costs set in Shopify.
- Buy Box needs price sync history, which accumulates over hours and days.
- FBA orders is empty unless you are using Multi-Channel Fulfilment.
The more products you link on the Product Mapping page and publish through Product Sync, the more complete every one of these reports becomes.
Related Articles
Margin report
The Margin report answers the question that revenue figures never do: after Amazon has taken its cut and you have paid for the goods, what is actually left? It is one of the four views on the Analytics screen, and like the rest of Analytics it is ...Suggested inventory
Suggested inventory answers one question: which of your FBA products are about to run out, and how many units does Amazon think you should send. It is one of the four views on the Analytics screen, and like the rest of Analytics it is available on ...Buy Box performance
The Buy Box is the "Add to basket" position on an Amazon product page. When several sellers offer the same product, Amazon awards that button to one of them, and the overwhelming majority of sales on that listing go to whoever holds it. If you do not ...Price floor and ceiling
The floor and the ceiling are the two most important settings in the Buy Box repricer, and the ones merchants most often get wrong. Together they define the band of prices the repricer may work within. It will never set a price outside that band, no ...Getting started
This page is the whole first-run journey in one place: install the app, choose a plan, then complete the five step setup checklist that takes you from an empty screen to live Amazon listings. Each step has a detailed article of its own, linked below. ...